Safeguarding the Stack: Ornithology of Stack Canaries
Investigating defense mechanisms for stack based buffer overflows.

During the industrial era canaries were given the unforgiving job of determining if working conditions were "safe" for coal miners. Within coal mines toxic fumes can build up, and oxygen can become scarce. The life of the canary was a litmus test for conditions supporting humans. Since then the canary is forever ingrained in our language as a subtle way of sensing danger.
As you may well already know, a stack overflow is a vulnerability caused by memory corruption within a running program. Executing such an attack can cause a program to crash, alter the flow of a program or even achieve arbitrary code execution. In the beginning there were no real defenses against stack overflows aside from good programming, which is inherently untrustworthy because programmers are humans and all humans make mistakes.
Stack overflows are obviously a problem because they could result in your system getting #pwnd. Eventually, the nameless and often underappreciated authors of open source software projects wizened up and decided to fortify their systems against memory corruption exploits. To my knowledge FreeBSD was the first OS to introduce a non-executable stack, meaning that data on the stack couldn't be treated as executable code. Nevertheless that is a story for another time.
Other stack protection mechanisms do exist and today we're going to explore the concept of the Stack Canary. This is a highly effective measure in that it will detect stack corruption and properly terminate a program before anything nasty can have. It is an ingenious protection in that it is highly effect, yet simple to impliment in that it requires only a few lines of assembly and a bit of boolean algebra to implement.
The basic steps for creating a stack canary are:
store a value on the stack beneath the return address.
copy this value into a register.
After filling a buffer, or at some other crucial point during execution XOR the value on the stack with its twin living in the register. Remember 1⊕ 1 = 0, 0⊕ 0 = 0, 0 ⊕ 1 = 1 and 1 ⊕ 0 = 1.
Check the result of the XOR operation. If the product of the XOR operation was 1 the value on the stack was tampered with, indicating memory corruption, terminate the program. If the XOR operation yields 0 there was no tampering and continue with normal execution.
You might already be scheming a bypass for this protective measure, thinking that you can just anticipate the value of the canary and fill your buffer with a spoof. Very clever of you. As you'll see later demonstrate later the problem with this is that the canary is a singular 4 byte integer or D-WORD, its value is will always be zero. Why? Wouldn't always having the same canary make it easier to spoof.
To my very limited understanding, most buffer overflows are a result of mishandling of string data. Recall that the string has a special termination sequence to mark its end, a sequence of x00/x00. In the event that we could reliably anticipate the location of the canary on the stack and insert a pair of null sequences on our own we would be terminating our own buffer. All in all this means that we have far less control over the stack, properly spoofing a canary ends the buffer.
The goal of most overflow vulnerabilities is to corrupt the return address, the memory address of the next line to be executed after the function closes. Because the return address is lower in memory than the canary we can not overwrite it, the canary is guarding the return address. This doesn't mean that using stack canaries is kryptonite for exploit developers, but they do provide a decent amount of protection against DOS and RCE.
In order to appreciate the brilliance and simplicity of the stack canary we're going to debug a program compiled with and without stack protections. If you'd like to follow along the system I'm rocking is an x86-64 Ubuntu 20.04, take a look at the canary.c program below:
#include<stdio.h>
#include<stdlib.h>
#include<string.h>

// canary.c
int overflow_me(char *buffy){
    char buffer[10];
    // strcpy is unsafe because it doesn't do boundaries checks on the
    // destination buffer.The buffer we defined is only 10 chars long,
    // but strcpy will let us put more then 10 chars into it. Believe
    // it or not this a huge problem. see man strcpy for more info.

    //Copying buffy into buffer
    strcpy(buffer,buffy);
    printf("buffer is now: %s\n",buffer);

    return 1;
    }

int main(int argc, char *argv[]){

    if(argc < 2){ //avoid segfault and exit cleanly
        printf("Usage: %s, <buffer>\n", argv[0]);
        exit(-1);
    }

    overflow_me(argv[1]);
    printf("Execution returned to main!\n");

    return 1;
}
We'll start by compiling our program without a stack canary using the -fno-stack-protector flag. We'll also run it with an oversized buffer and take a quick peak at it's assembly.
~$ gcc -g -fno-stack-protector -o no_canary canary.c
~$ ./no_canary Usage: ./no_canary, <buffer>
~$ ./no_canary foo
buffer is now: foo
Execution returned to main!
No problems here, as the size of data being copied into the buffer is within its bounds and everything runs as expected. We know that the destination buffer has an allocated memory of 10 bytes. What happens when we send 11 bytes to it?
~$ ./no_canary $(perl -e 'print "A"x11')
buffer is now: AAAAAAAAAAA
Execution returned to main!
Segmentation fault (core dumped)
As you can see we overflowed the buffer by one byte and this was enough to cause a segmentation fault. A buffer overflow did occur but it was not severe enough to block the function from returning to main. If we increase the size of the malicious buffer we can block execution from returning to main, which is exactly what happens in our next example.
~$ ./no_canary $(perl -e 'print "A"x30')
buffer is now: AAAAAAAAAAAAAAAAAAAAAAAAAAAAAA
Segmentation fault (core dumped)
In the section above we overflow 20 bytes past the limit of the buffer. The printf function doesn't care about the size of the string it is printing, it reads until it encounters the termination sequence of a string, the /x00/x00 discussed earlier.
When a function is called a return address resides on the top of the stack, this address will be moved into the Register Instruction Pointer when a function closes. In the example above we overflowed the entire stack and filled the return address with a bunch of junk. When the function closes the instruction pointer no longer "knows" where to resume execution in the caller function because it is filled with a bunch of 0x41's, the hexadecimal representation of A.
To see this process live in action we're going to observe the assembly dump and the program during execution with the gdb debugger. A debugger is essentially a microscope, it allows us to see into the smallest aspects of computer programs. Unlike a microscope a debugger allows us to pause our program, and even change values as it runs. Imagine how many scientific advances could be made if microscopes allowed biologist to pause a bacteria or virus and interact with it in real time !
~$ gcc -g -o no_canary canary.c -fno-stack-protector
~$ gdb -q no_canary
(gdb) set disassembly-flavor intel
(gdb) disass overflow_me

(gdb) break 13 Breakpoint 1 at 0x11b9: file canary.c, line 13.
(gdb) break 15 Breakpoint 2 at 0x11cc: file canary.c, line 15.

(gdb) run AAAAAAAAAAAAAAAAAAAAAAAAAAAAAA
After compiling the program and hooking the executable to the debugger we set the disassembly flavor, or syntax to intel. If we want to permanently set out disassembly flavor we could run echo "set dissasembly-flavor -intel" >> ~/.gdbinit if we so desire. The real fun begins when we start setting break points, the first is at the strcpy function with overflow_me and the second is in the printf statement that prints out buffer after the data is copied in. If you're following along your program might look a little different from mine, you'll have to find exactly which line these functions are called at by running list overflow_me or list 13 where 13 is the line number of the C program. Lastly, we run the program just like we did in the terminal with 30 A's.
To view the assembly language translation of our C program we can use the disass <function_name> command to dump the disassembly out put. I'm going to assume that this isn't you're first time looking at assembly and spare you the nitty gritty of the instruction syntax. Below are pictures of the disassembly dumps for the overflow_me function.
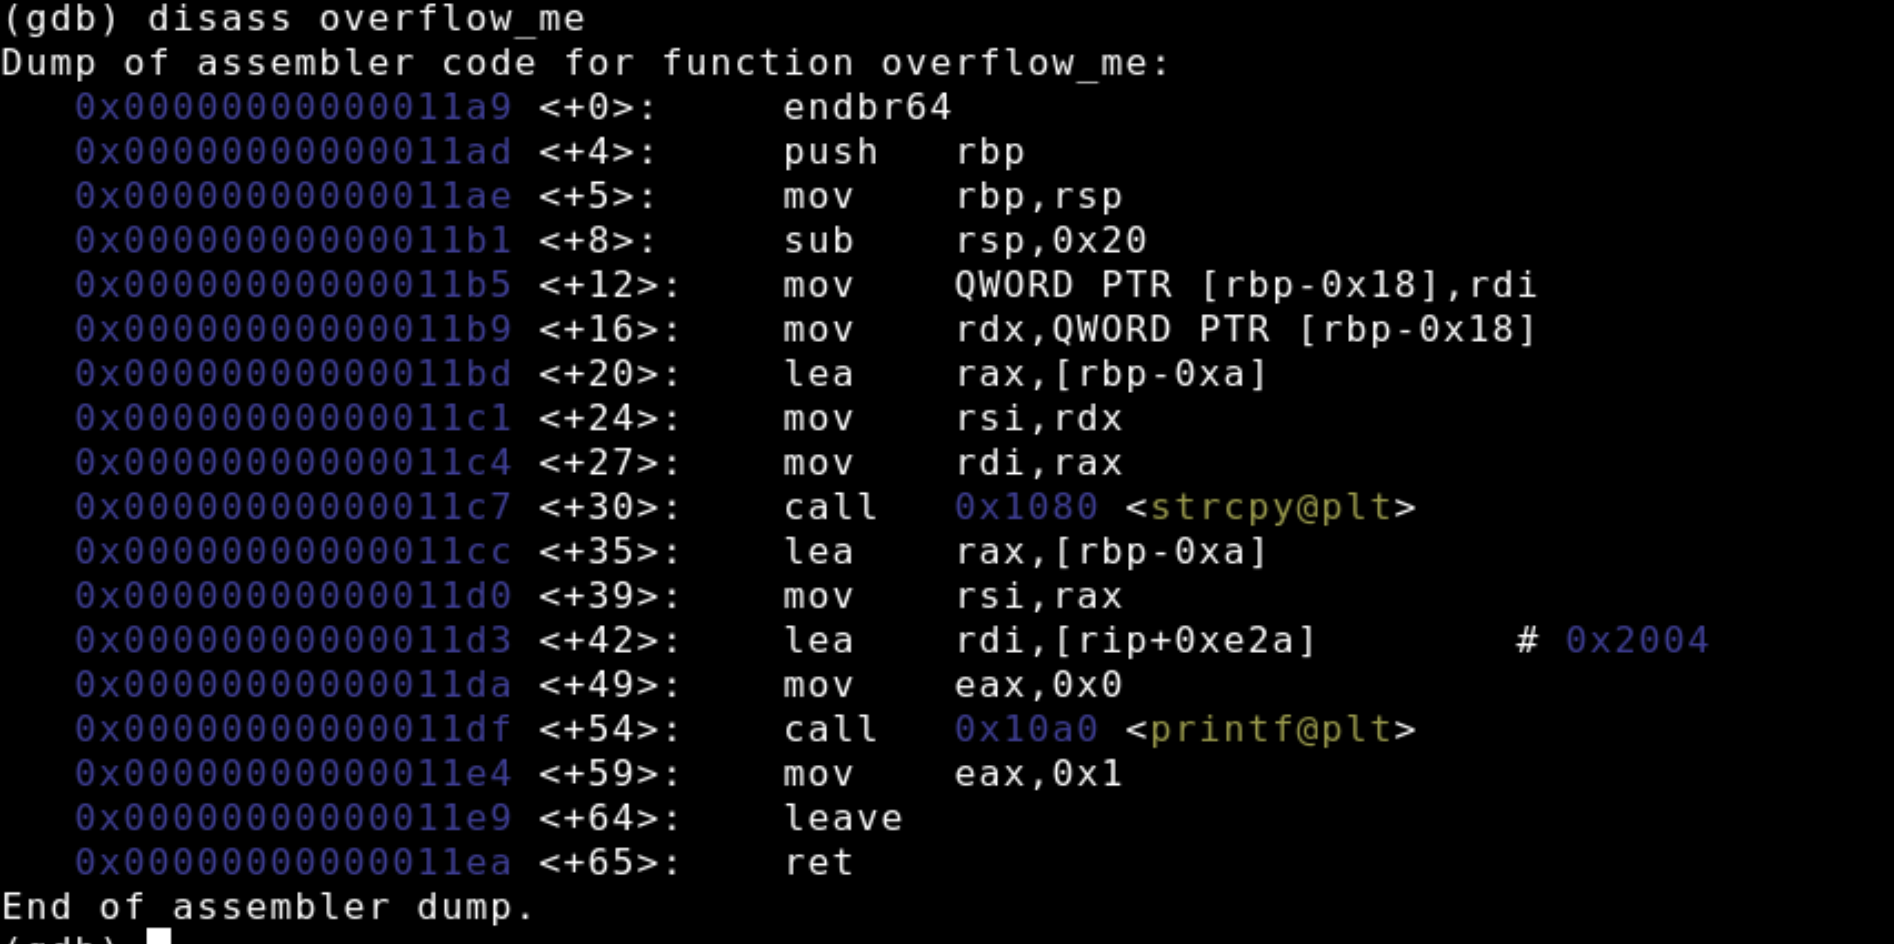
Remember the big picture, we're investigating how stack canaries protect the return address from being overwritten. The stack frame for overflow_me will have a return address of an instruction located in main. We're going to dump the assembly of main with the command disass main to find the memory address for the instruction directly after the call to overflow_me. We'll then observe this address at the top of the stack during overflow_me execution.
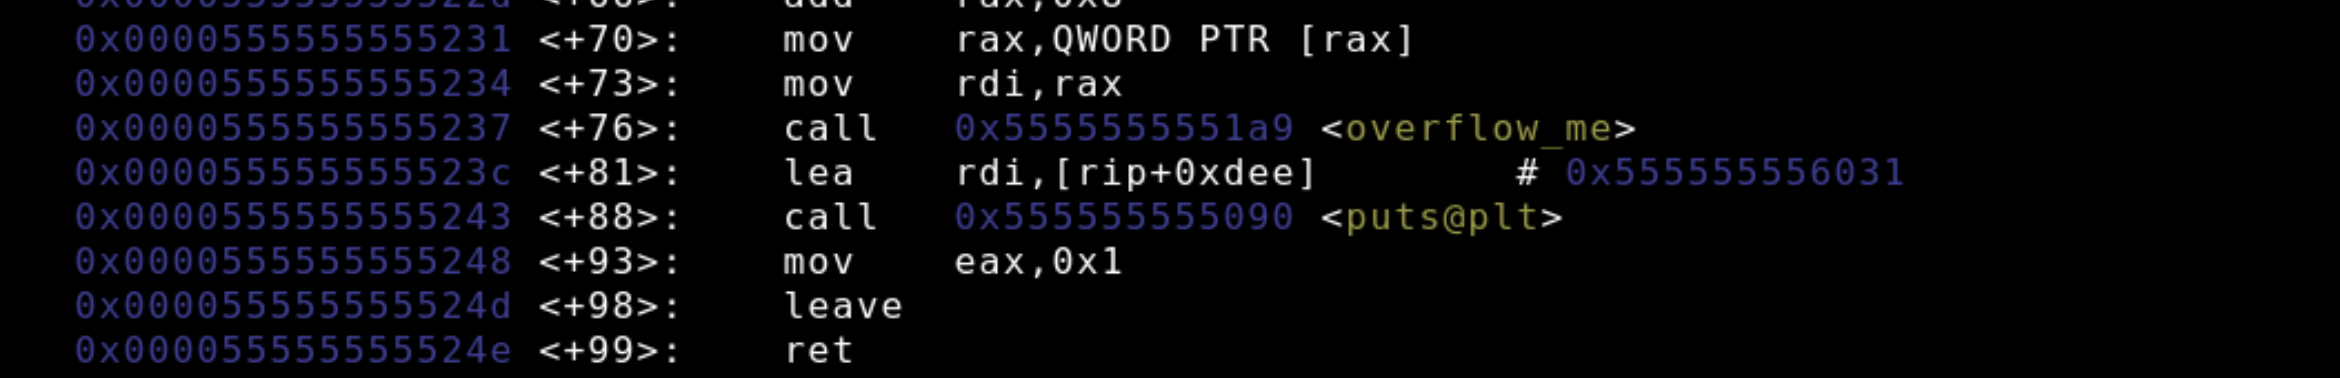
At 0x0000555555555237overflow_me is called and the next instruction lea rdi, [rip+0xdee] has an address of 0x000055555555523c, this is the address that we'll be looking for on the stack. Next, we're going to observer the stack before and after the buffer is filled. We start by inspecting the rip, rsp, and rbp registers. All of these registers are pointers. In order to see where the buffer variable lies in relation to the return address we'll print out its location on the stack with p &buffer. Lastly, we'll observe the contents of the stack by running x/20x $rsp which examines 20 bytes in hexadecimal format from the address at rbp. You may need to format these bytes as words (4 byte increments) by using x/20xw $rsp.
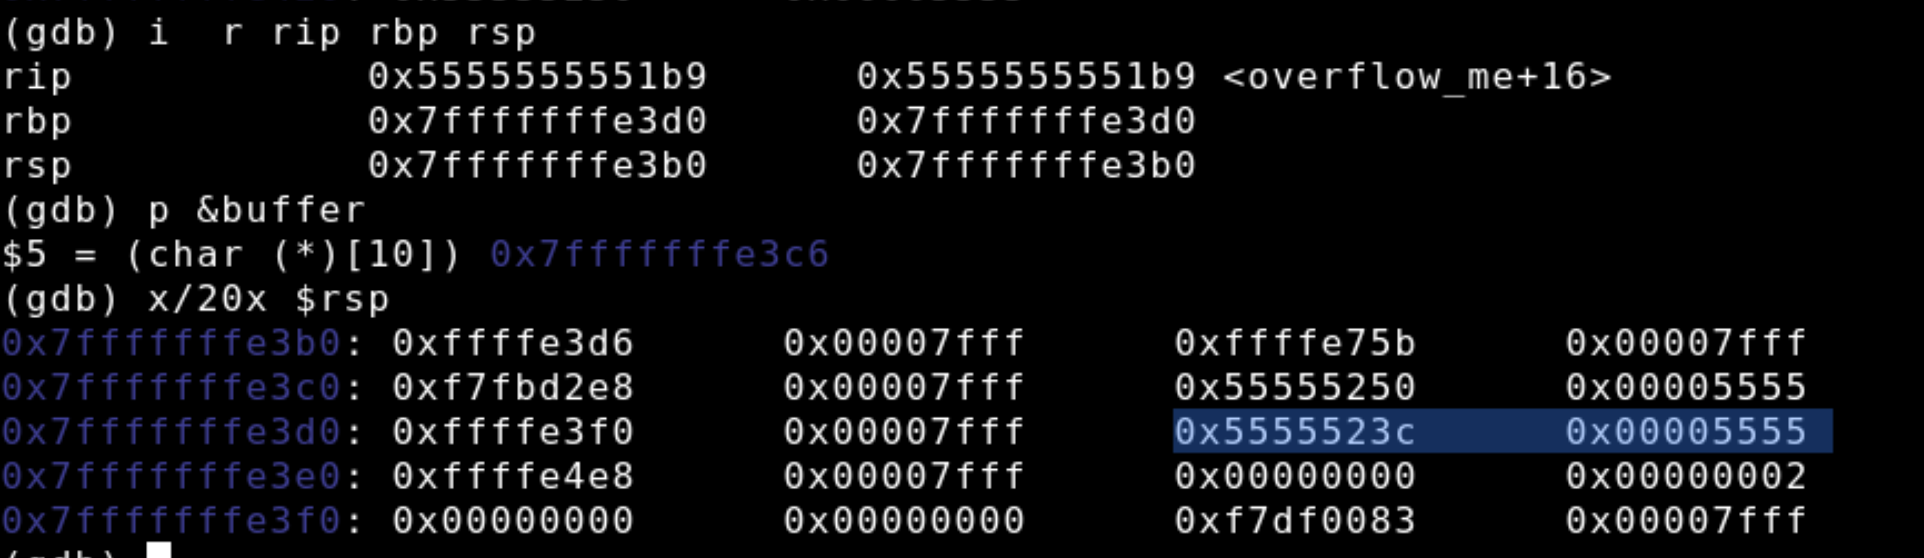
In the last command we see the entirety of the overflow_me stack frame plus a little extra. Highlighted in blue is the return address that we found earlier, it lies just a few bytes above the current stack frame. The address is "backwards" because the architecture for the CPU is little-endian, which stores the least significant byte first. We can also see the buffer variable on the stack beginning in the second column of the 0x7f....e3c0 line. Notice that the data it is filled with is nothing in particular, just a bunch of junk because nothing has been copied into our buffer.
We can let our program move to the next break point, a call to printf, with the cont command. At this point in the program strcpy has overfilled the buffer with a bunch of A's. We'll re-examine the stack with an x/20xw $rsp call.
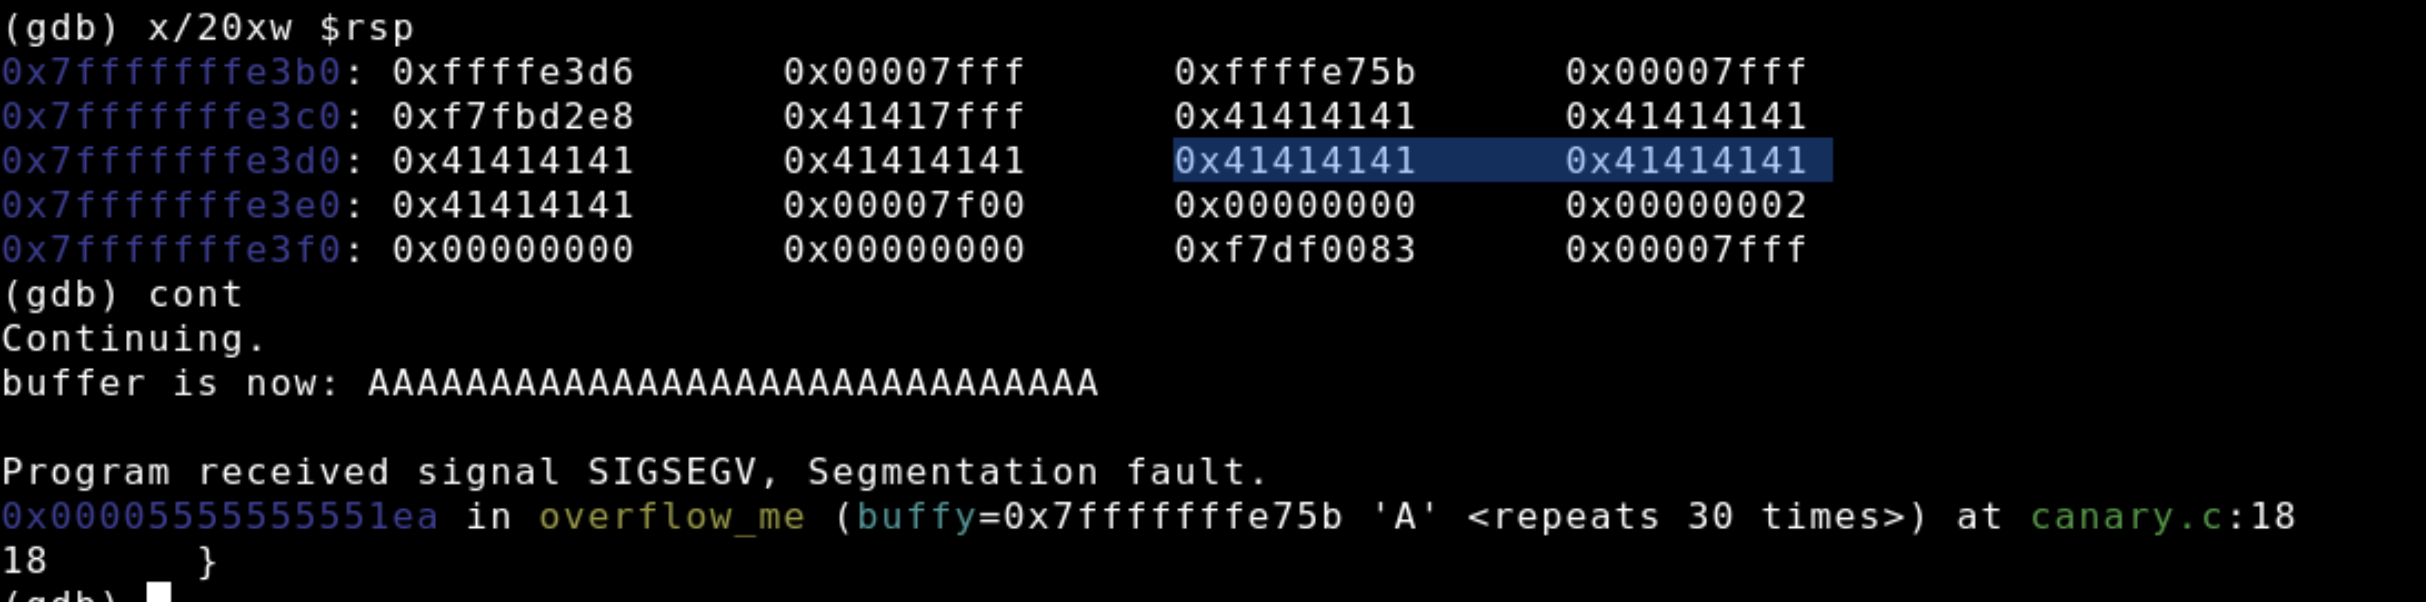
As you can see 0x41, the hexadecimal representation of A populates almost the entire stack, including where the return address once and as shown by the blue highlight it is filled with 0x41's. So when we continue execution and the overflow_me function returns it will take the return address and move it into rip. Now the program wants to execute the instructions at 0x414141414... but nothing is there so the program crashes.
In scientific fashion we'll repeat the steps from earlier to see not only how the stack canary protects from overwriting the return address by providing smooth termination during an overflow but also how the CPU actually implements it in assembly language functions. We start by recompiling our program, but this time omitting the -fno-stack-protector flag.
$~ gcc -g -o canary canary.c
~$ gdb -q canary
Reading symbols from canary..
Once again we'll set our break points at the calls to strcpy and printf.
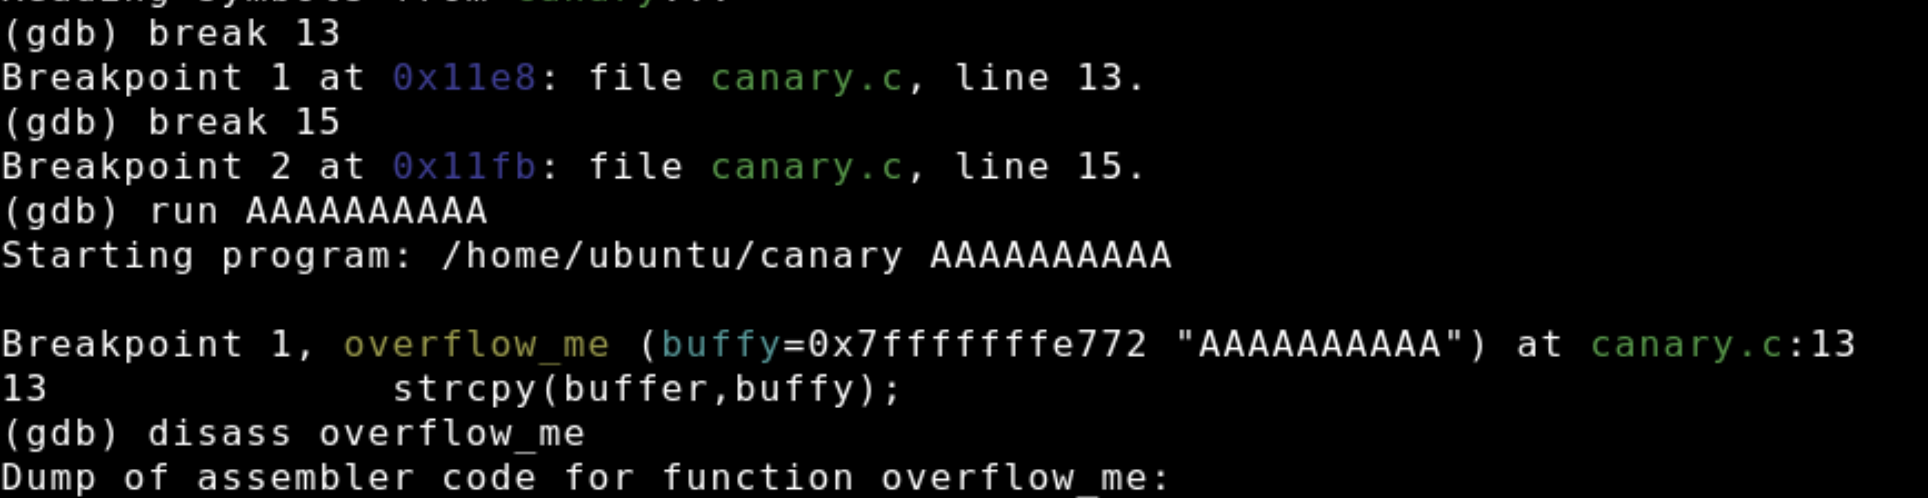
After dumping the assembly for the overflow_me program once more notice how that compiling the program without the -fno-stack-protector flag changes the assembly of the program. Some of the new instructions are for implementing the stack canary. The picture below shows the canary being setup before the call to strcpy.

The first step in setting up the canary is moving a 4 byte integer, or QWORD from the fs register to rax. Next the canary is moved from rax and onto the stack 8 bytes below rbp. The brackets syntax are used like pointers, so [rbp-0x8] means that address at rbp minus 0x8.
Recall that the stack canary is used to detect buffer overflows by checking if the value on the stack, in this case at rbp-0x8 is equivalent to the value stored in the fs register. The picture below shows exactly the steps for accomplishing this.
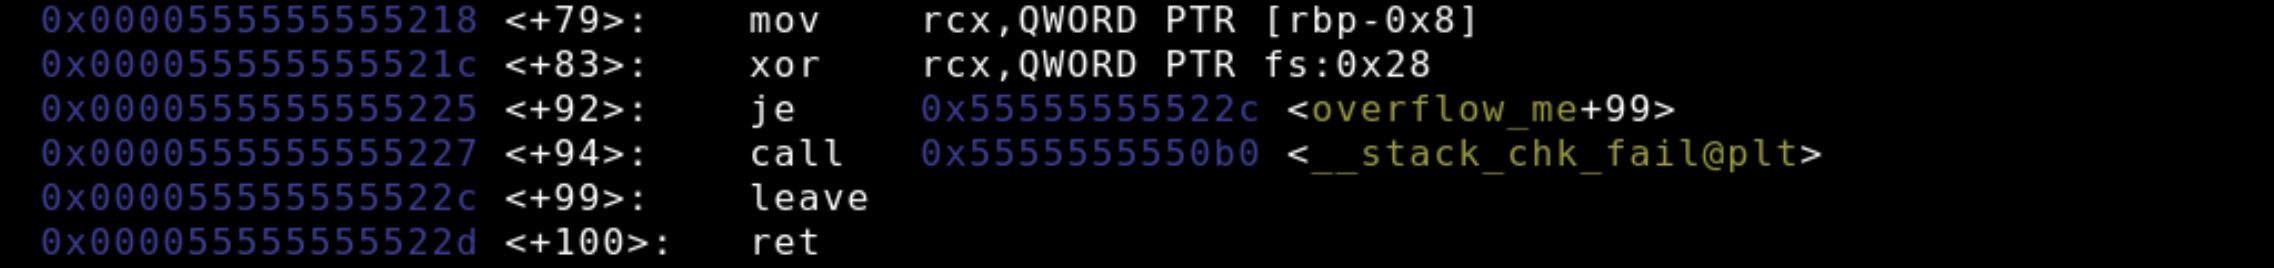
rax is typically used to store the return values of functions, so the program moves the stack canary into the rcx register and then the value in rcx is xor'ed against the fs register. If values of rcx and fs are equal the xor operation will yield 0 and the program will follow the normal closing procedure and jump execution to the leave instruction. However, if they are different i.e. a stack overflow occurred, the program will jump to the function call for __stack_chk_fail in order to mitigate damages from the stack overflow and terminate the program with a memory corruption warning.
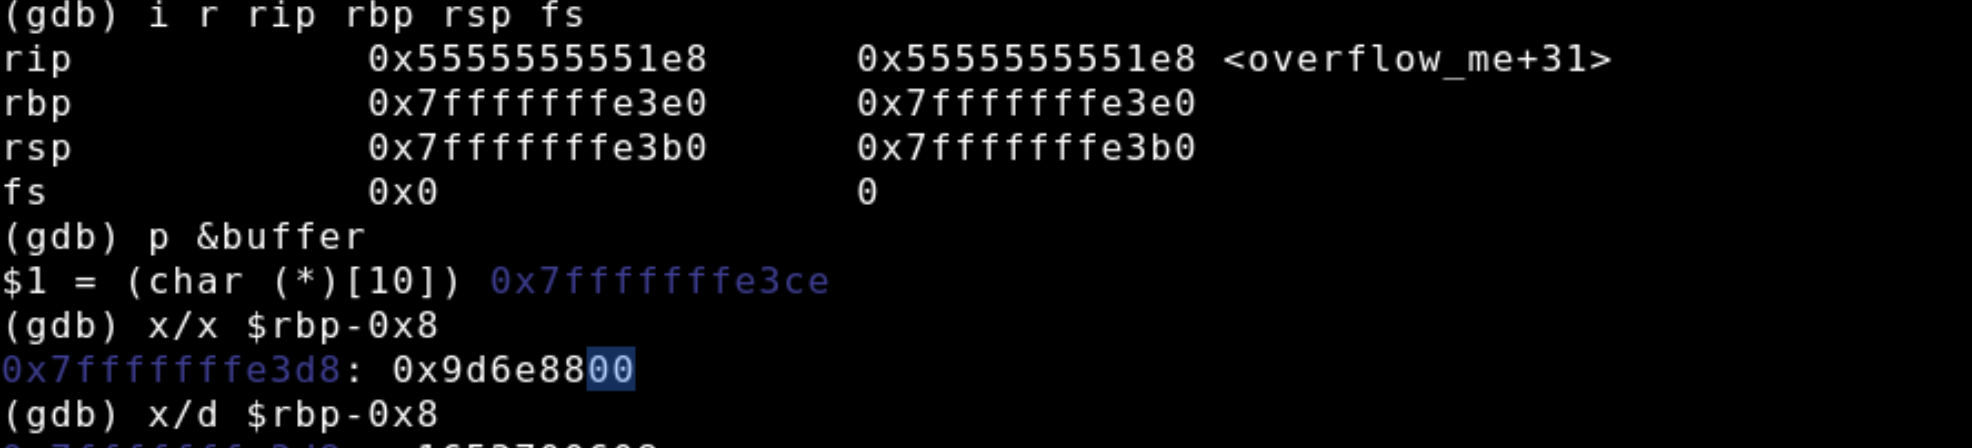
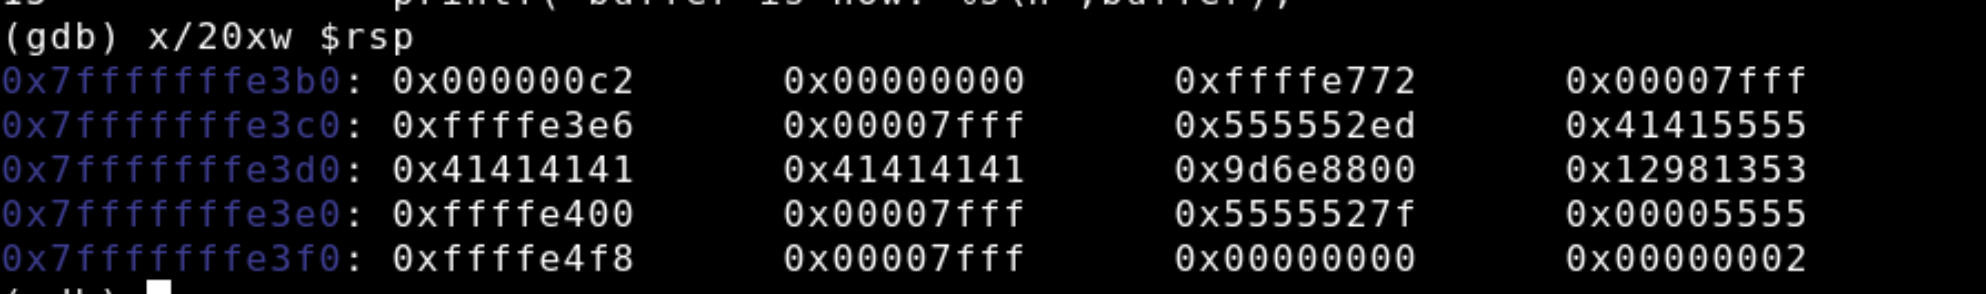
After allowing the program to run up until the call to strcpy we inspect the values in the register instruction pointer, base pointer, stack pointer, and of course fs. Notice how the value in fs is small, containing a simple zero. Additionally, we print out the address of the buffer, and examine the address and the value stored at rbp-0x8 which highlighted in blue is zero.
We mentioned earlier that the stack grows upwards towards lower addresses. Shouldn't the address of canary be lower than that of the buffer? When allocating memory the stack certainly does grow this way. However, a buffer will be filled from lower addresses to higher, which makes since because the start of the buffer is technically the lowest address. All in all this means that buffers are filled from low to high.
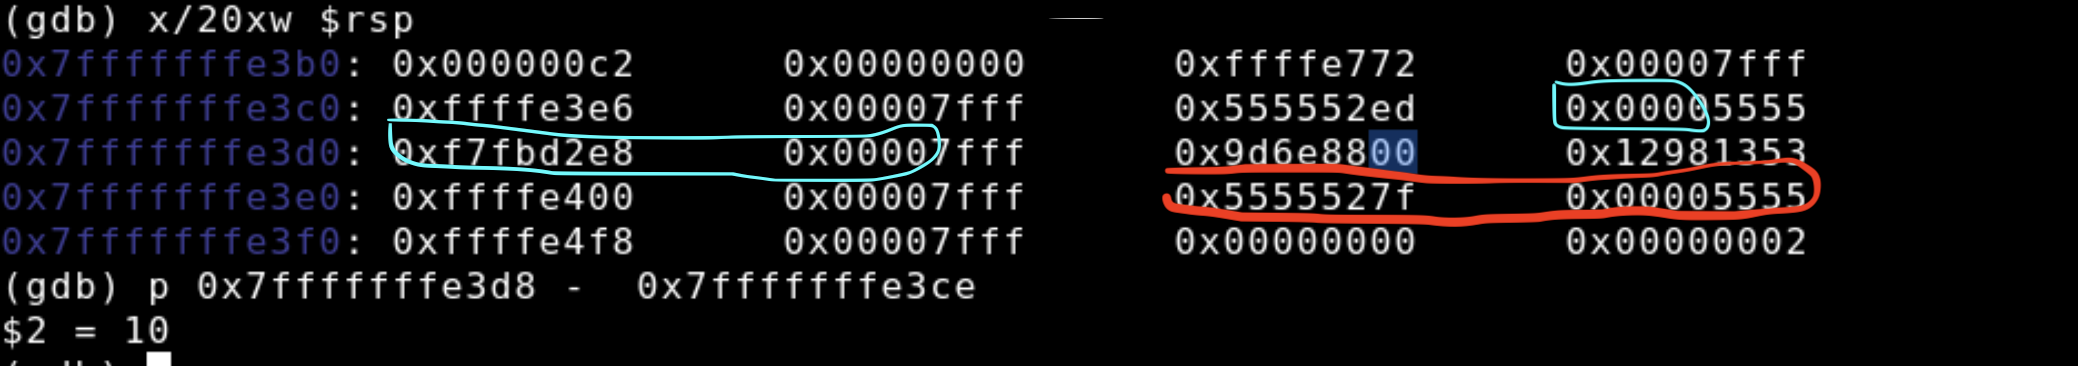
In the picture below we examine the entirety of the stack, the address range for the 10 byte buffer variable is roughly circled in the light blue stencil, the canary is highlighted with the blue courser, and the return address is circled in red.
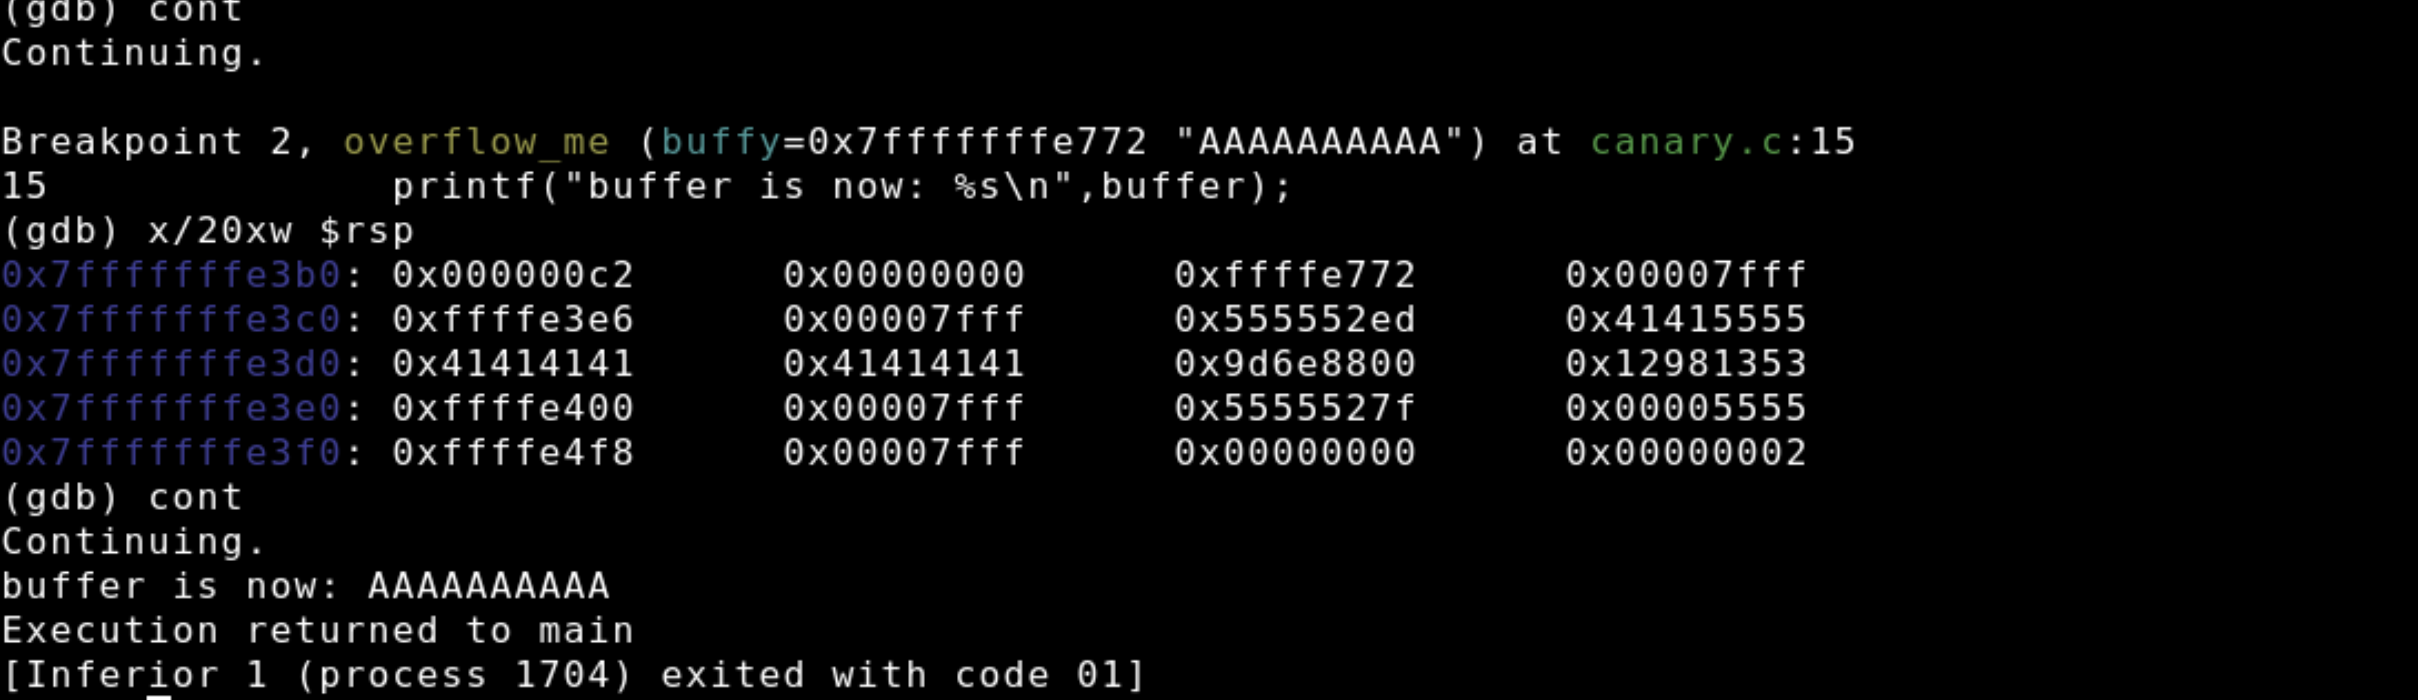
We'll continue letting our program run and hit the next break point at printf. Then we'll re-examine the stack and see that the buffer is now filled with 10 0x41's or A's that we supplied when originally running our program. Notice how the growth of the buffer is creeping towards the canary and the return address.
As you can see below, the program executes normally as expected.
Lastly, we'll re-run the program and supply an oversized buffer. After copying the buffer into the stack we see that the canary is now altered as highlighted in blue. Notice how can write well past the canary.
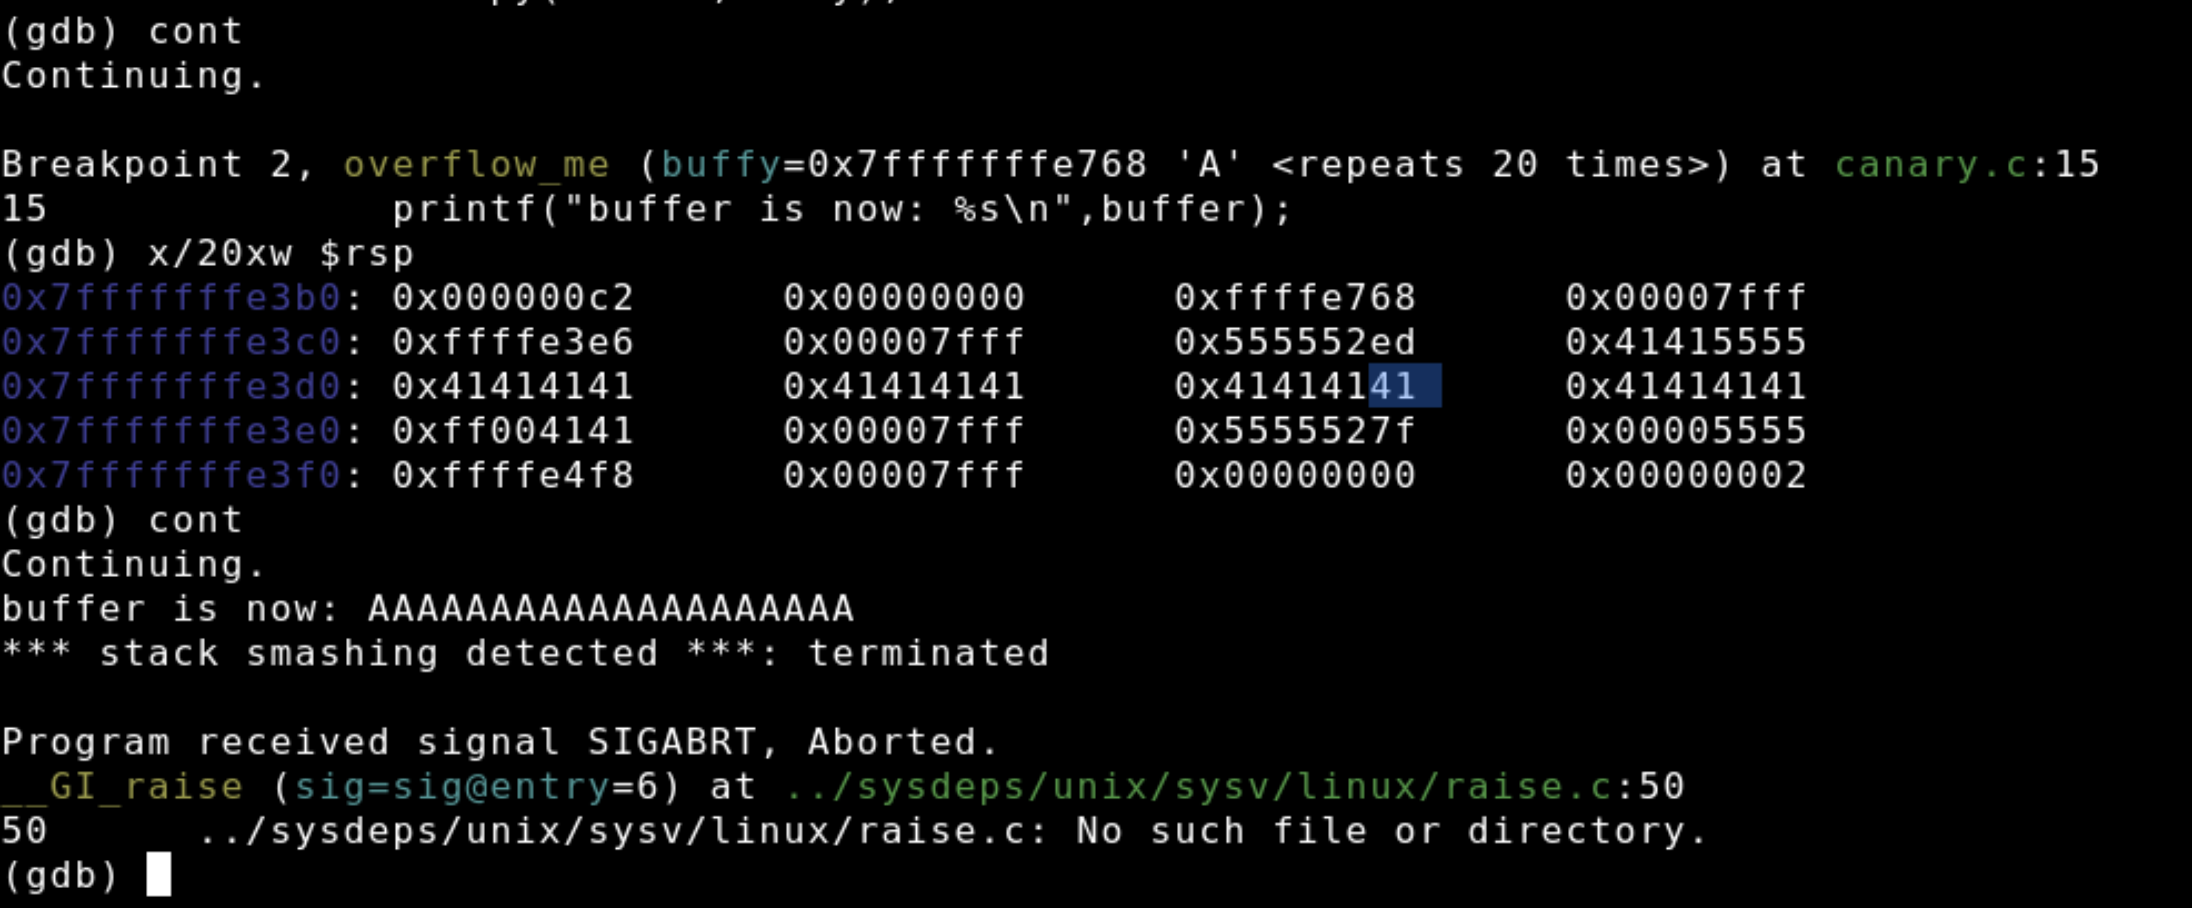
The canary doesn't stop buffer overflows, it just catches them and terminates the program safely by calling __stack_chk_fail. Even if we wrote past the canary and were to alter the return address to point to some libc function or shell code on the stack it wouldn't do much because the return address on the stack will no longer be the target of execution once the function closes.
Thanks for reading, if you'd like to collaborate you can catch me on Github or LinkedIn.


